-
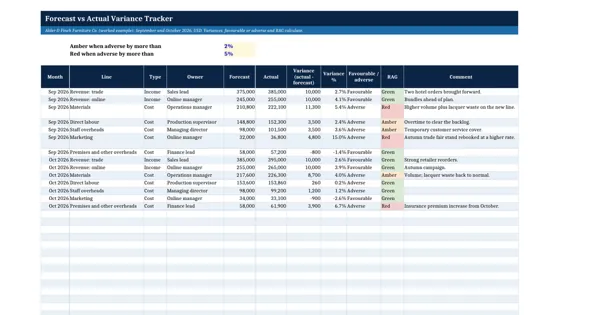 Excel workbook preview
Goals, OKRs, KPIs and Business Performance
Forecast vs Actual Variance Tracker
3 downloads per free account, no card needed.
Who this is for
A finance lead who has to explain to the owner why profit differed from forecast this month downloads this to log every variance with its owner and reason.
What is inside
- 14 sample rows: 7 profit and loss lines for two months with forecast and actual
- Variance in money and %, and favourable or adverse worked out for income and cost lines
- RAG from your thresholds: adverse up to 2% Green, up to 5% Amber, above 5% Red
- Owner and comment per line; a Red row without a comment turns amber
- Summary sheet rebuilding operating profit by month and totals by line, with a chart
- Dropdowns for line and type, filters, frozen headers and 20 blank rows
How to use it: After each month-end close add one row per line with the latest forecast and the actual, and have each owner explain every Amber and Red variance.
Files & formats
- XLSXforecast-vs-actual-variance-tracker.xlsx15 KB
Opens in Microsoft Word or Excel, Google Docs or Sheets and LibreOffice. Delivered instantly from your browser.
Free downloads & full access
Every account gets 3 free downloads. Re-downloading a template you already have does not count. This template on its own is $17.99, and buying it keeps your free downloads for something else. Full access is a one-time $249 for all 300 templates, for life.
Bought with a different email? Open your account and enter your order number.
Licence
Use and adapt the document inside your own organisation or for your own clients. Do not resell or republish the templates themselves.
More in Goals, OKRs, KPIs and Business Performance
Goals, OKRs, KPIs and Business Performance
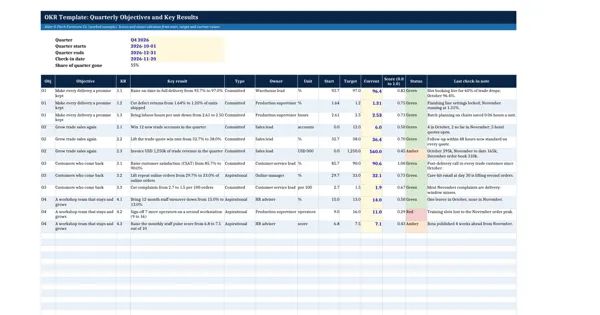
OKR Template (Quarterly Objectives and Key Results)
Goals, OKRs, KPIs and Business Performance
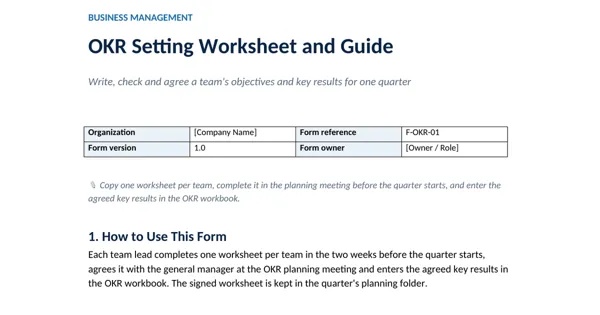
OKR Setting Worksheet and Guide
Goals, OKRs, KPIs and Business Performance
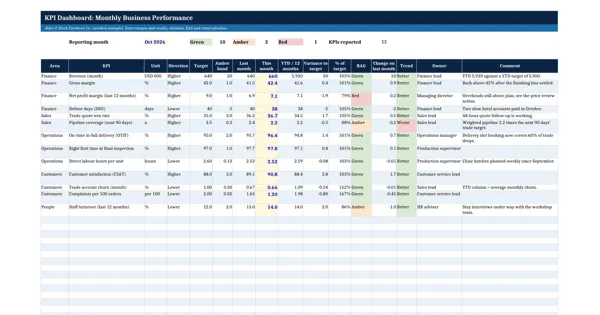
KPI Dashboard Template (Small Business)
Goals, OKRs, KPIs and Business Performance